FLOWCHARTS
┉┅━━━━━ ✧ ━━━━━┅┉
◇ Flowcharts ◇
┉┅━━━━━ ✧ ━━━━━┅┉
.png)
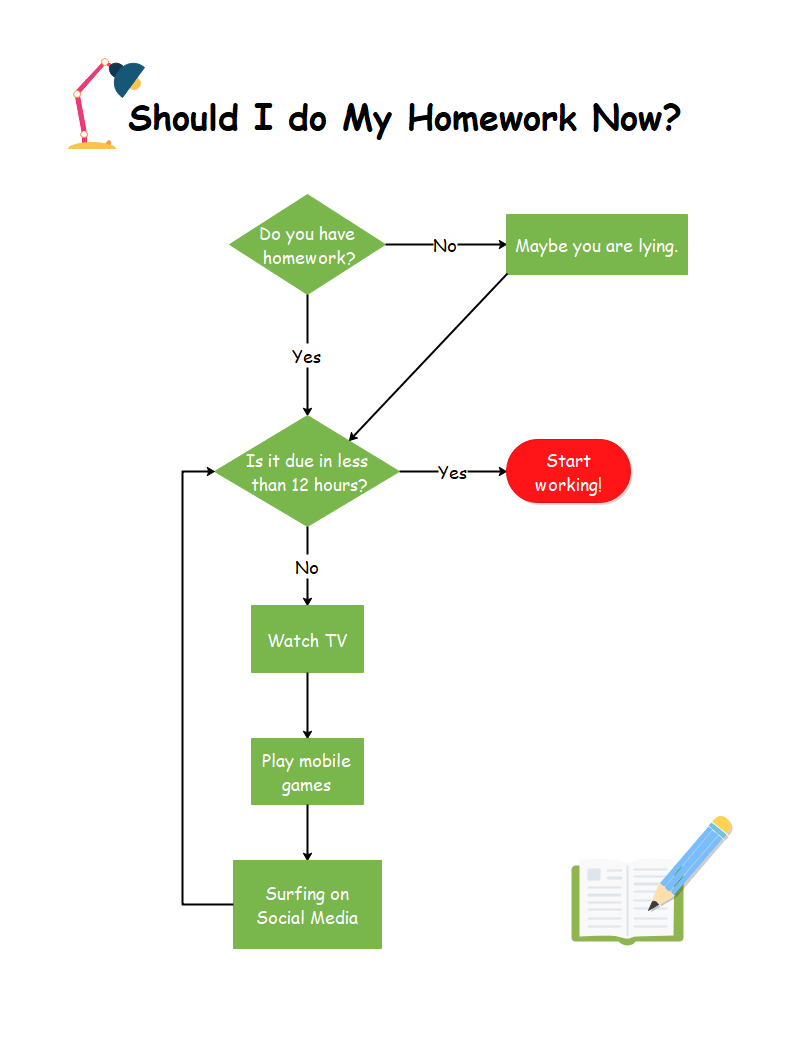
A flowchart is a diagram that shows the steps in a system, computer program, workflow, or process. In order to facilitate decision-making, reduce ambiguity, and improve workflows, flowchart diagrams are made up of shapes joined by lines.

When industrial engineers Frank and Lillian Gilbreth presented the Flow Process Chart to the American Society of Mechanical Engineers (ASME) in 1921, the history of flowcharts officially began. "Process Charts: First Steps in Finding the One Best Way to Do Work," their presentation, introduced flowcharts as a technique for simplify workflow. Engineers improved the idea throughout coming years, and in 1947 the ASME defined a set of flowchart symbols that were based from the Gilbreths' work.
Activity diagrams, which are digital flowcharts made with specialist software, were first presented by the Unified Modeling Language (UML) in the 1990s. The goal of UML was to enhance the application of flowchart symbols in software design by standardizing them. Business Process Modeling and Notation (BPMN), a common modeling language for graphically representing business processes and removing ambiguities in textual descriptions, was created by the Business Process Management Initiative (BPMI) by 2005. These days, there are many online flowchart creators that come with flowchart templates to make the process easier, like Lucid charts, Pseint (for coding), Canva and Miro.
There are as many different kinds of flowcharts as there are applications for them, making them a crucial document in almost every industry. A vast array of processes and procedures can be designed, visualized, and documented using flowcharts.
✓Documenting a process or procedure
✓Brainstorming ideas
✓Business process management (BPM) and business process analysis (BPA)
✓Increasing clarity and improving communication between colleagues and teams
✓Outlining a decision-making procedure
✓Clarifying the reporting structure of an organization
✓Optimizing a process or workflow
✓Explaining how a process is done


Because of their simplicity and adaptability, flowcharts are utilized frequently in a variety of areas and sectors. By illustrating a program's logic, they assist programmers in creating algorithms and analyzing code. Flowcharts are used in business to increase productivity, optimize processes, and map out workflows. They can, for instance, show the phases of a product development cycle or the processes in a customer support system. Flowcharts are used in education as helpful tools to clarify difficult ideas or procedures, including the scientific method or frameworks for making decisions. Flowcharts are also used in project management to organize and track work, in engineering to design systems, and in healthcare to standardize medical procedures.
Specific Examples of Use:
⁂Computer Science: Flowcharts are used to design algorithms, such as sorting or searching routines, before translating them into code. For instance, a flowchart can visually represent the steps of a binary search algorithm.
⁂Business Process Management: Companies use flowcharts to map out workflows, such as order processing or employee onboarding, to identify bottlenecks and improve efficiency.
⁂Education: Teachers use flowcharts to explain processes like the water cycle or the steps of a math problem, making abstract concepts more tangible for students.
⁂Healthcare: Hospitals use flowcharts to standardize procedures, such as patient triage or emergency response protocols, ensuring consistency and reducing errors.
⁂Engineering: Engineers use flowcharts to design systems, such as electrical circuits or manufacturing processes, ensuring all components work together seamlessly.
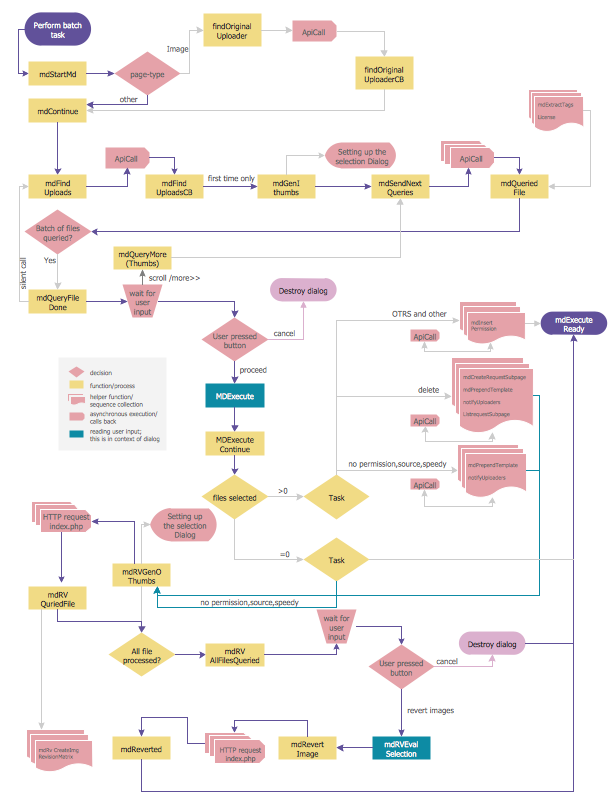 |
| Flowchart are really useful in the learning process of programming |
Date: February 20, 2025.


Comentarios
Publicar un comentario